This post rounds out the year and my series of articles on SAS REST APIs. You can read all of my posts on this topic here. The first two articles in the series: Using SAS Viya REST APIs to access images from SAS Visual Analytics and Using SAS Cloud Analytics Service REST APIs to run CAS Actions, examined how to use SAS Viya REST and SAS CAS REST APIs to access SAS data from external resources. Access the links to for a quick detour to get some background. This article takes things a step further and outlines how to use a simple application to interact with SAS Viya using REST APIs.
What do chocolate and toffee have to do with optimization? Read on and find out.
The application
When deciding on an example to use in this article, I wanted to focus on the interaction between the application and SAS, not app complexity. I decided to use an application created by my colleague, Deva Kumar. His OptModel1 is an application built on the restAF framework and demonstrates how SAS REST APIs can be used to build applications that exploit various SAS Viya functionalities. This application optimizes the quantities of chocolate and toffee to purchase based on a budget entered by the user.
Think of the application as comparable to the guns and butter economic model. The idea in the model is the more you spend on the military (guns), the less you spend on domestic programs and the civilian goods (butter). As President Johnson stated in 1968, "That bitch of a war, killed the lady I really loved -- the Great Society." In this article, I'll stick to chocolate and toffee, a much less debatable (and tastier) subject matter.
The OptModel1 application uses the runOptmodel CAS action to solve the optimization problem. The application launches and authenticates the user, the app requests a budget. Based on the amount entered, a purchase recommendation returns for chocolate and toffee. The user may also request a report based on returned values. In the application, OptModel1 and SAS interact through REST API calls. Refer to the diagram below for application code workflow.
Create the application
To create the application yourself, access the source code and install instructions on SAS' github page. I recommend cloning, or in the least, accessing the repository. I refer to code snippets from multiple files throughout the article.
Application Workflow
Represented below is the OptModel1 work flow. Highlighted in yellow is each API call.
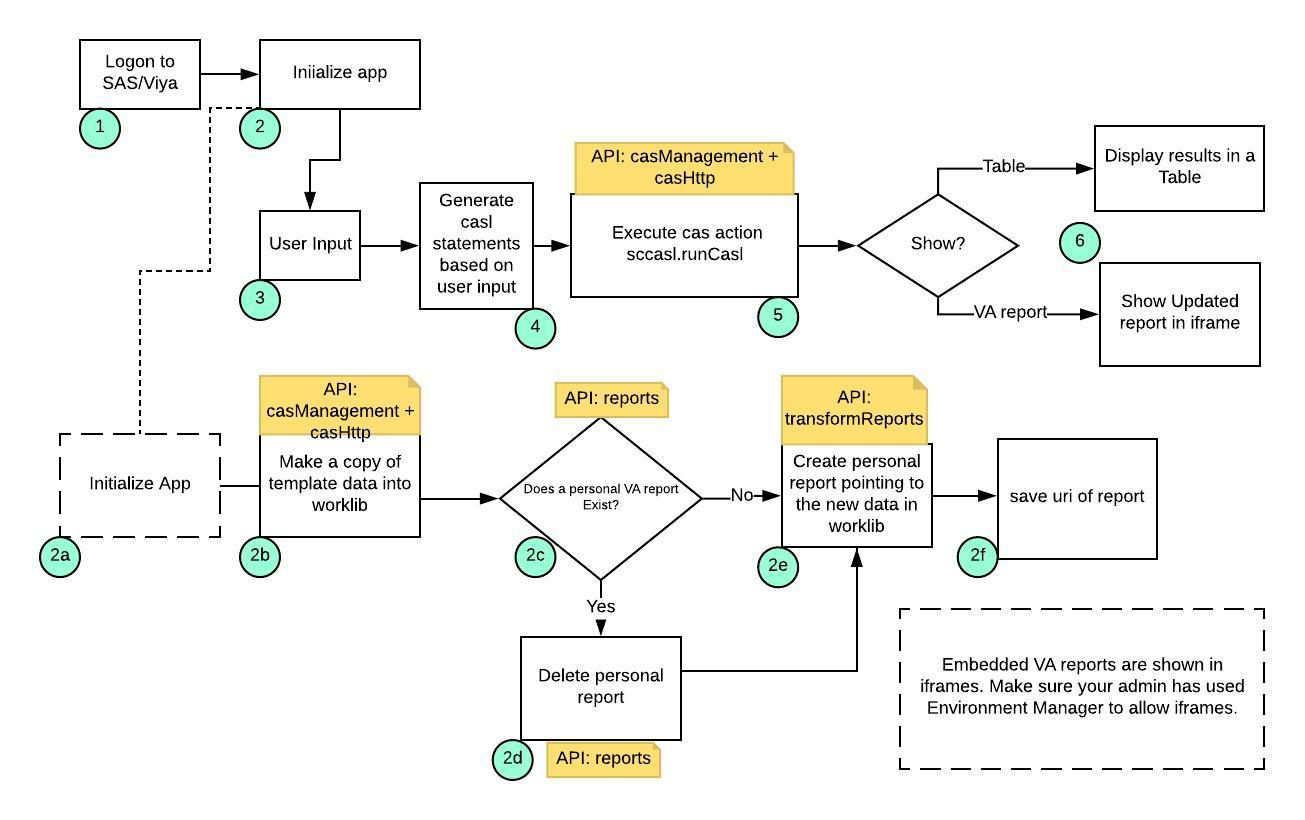
Outlined in the following sections is each step in the work flow, with corresponding numbers from the diagram.
Launch the application
Enter url http://localhost:5006/optmodel in a browser, to access the login screen.
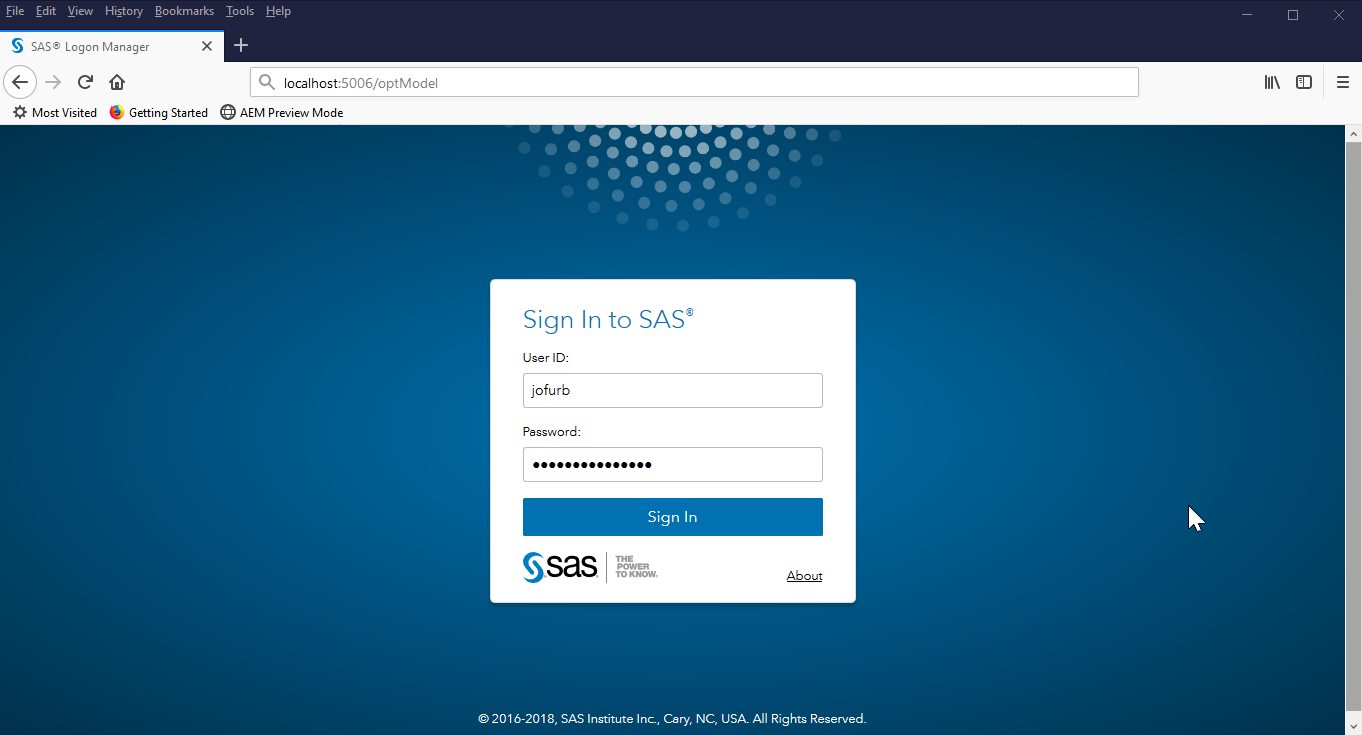
1. Login
Enter proper credentials and click the 'Sign In' button. The OptModel1 application initiates authentication in the logon.html file with this code:
<script> function logonButton() { let store = restaf.initStore(); store.logon(LOGONPAYLOAD) .then(msg => console.log(msg)) .catch(err => alert(err)); } </script> |
Application landing page
After successfully logging in, the application's main page appears.
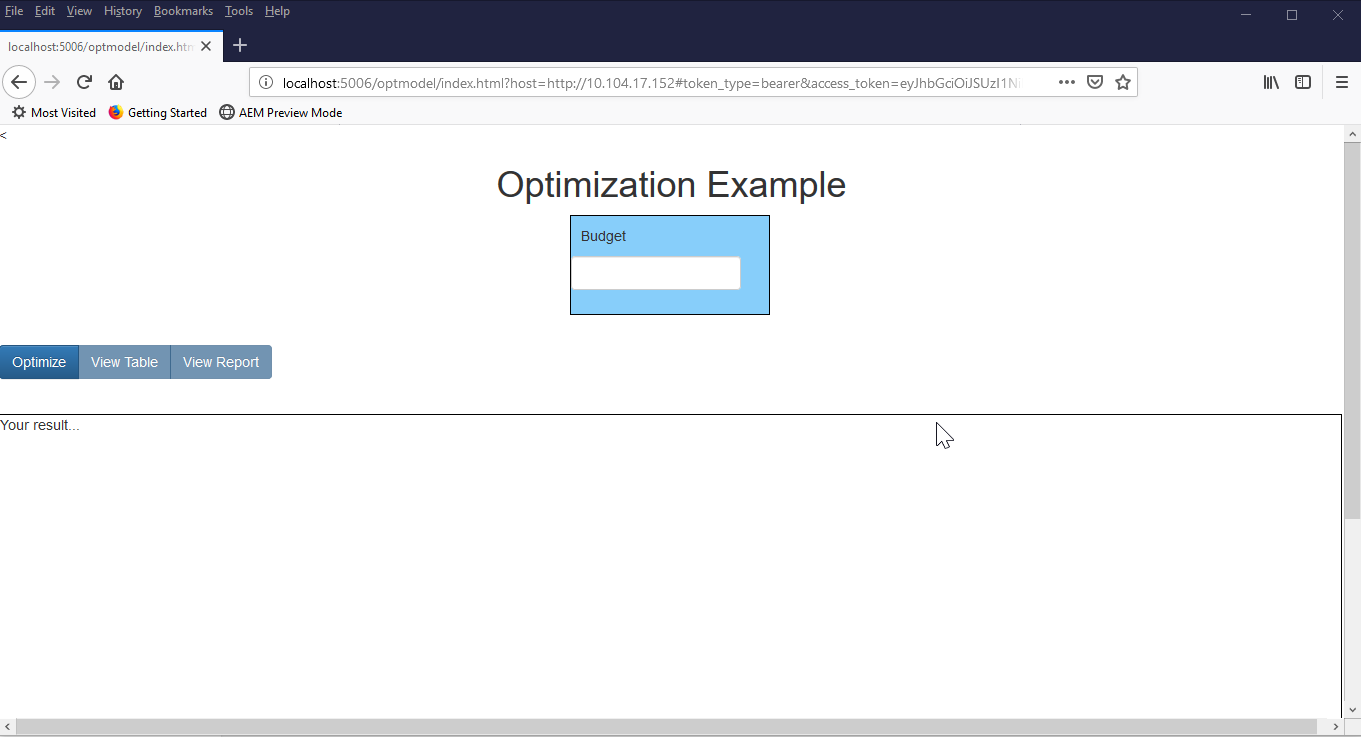
Notice how the host and access token are part of the resulting url. For now, this is as far as I'll go on authentication. I will cover this topic in depth in a future article.
As I stated earlier, this is the simplest of applications. I want to keep the focus on what is going on under the covers and not on a flashy application.
2a. Application initialization
Once the app confirms authentication, the application initialization steps ensue. The app needs to be available to multiple users at once, so each session gets their own copy of the template Visual Analytics (VA) report. This avoids users stepping on each other’s changes. This is accomplished through a series of API calls as explained below. The code for these calls is in vaSetup.js and reportViewer.js.
2b. Copy data
The app copies data from the Public caslib to a temporary worklib – a worklib is a standard caslib like casuser. The casl code below is submitted to CAS server for execution. The code to make the API call to CAS is in vaSetup.js. The relevant snippet of javascript code is:
// create casl statements let casl = ` /* Drop the table in memory */ action table.dropTable/ caslib='${appEnv.work.caslib}' name='${appEnv.work.table}' quiet=TRUE; /* Delete the table from the source */ action table.deletesource / caslib='${appEnv.work.caslib}' source='${appEnv.work.table}.sashdat' quiet=TRUE; /* Run data step to copy the template table to worklib */ action datastep.runCode / code=' data ${appEnv.work.caslib}.${appEnv.work.table}; set ${appEnv.template.caslib}.${appEnv.template.table}; run;'; /* Save the new work table */ action table.save / caslib = '${appEnv.work.caslib}' name = '${appEnv.work.table}' replace = TRUE table= { caslib = '${appEnv.work.caslib}' name = '${appEnv.work.table}' }; /* Drop the table to force report to reload the new table */ action table.dropTable/ caslib='${appEnv.work.caslib}' name='${appEnv.work.table}' quiet=TRUE; `; // run casl statements on the server via REST API let payload = { action: 'sccasl.runCasl', data: {code: casl} } await store.runAction(session, payload); |
2c. Does report exist?
This step checks to see if the personal copy of the VA report already exists.
2d. Delete temporary report
If the personal report exists it is deleted so that a new one can be created using the latest VA report template.
// If temporary report exists delete it - allows for potential new template report let reportsList = await getReport( store, reports, `${APPENV.work.report}`); if ( reportsList !== null ) { await store.apiCall(reportsList.itemsCmd(reportsList.itemsList(0), 'delete')); }; |
2e. Create new report
A new personal report is created. This new report is associated with the table that was created in step 2b.
// make the service call to create the temporary report let changeData = reportTransforms.links('createDataMappedReport'); let newReport = await store.apiCall(changeData, p); |
2f. Save report info
A new personal report is created. This new report is associated with the table that was created in step 2b.
// create src parameter for the iframe let options = "&appSwitcherDisabled=true&reportViewOnly=true&printEnabled=true&sharedEnabled=true&informationEnabled=true&commentEnabled=true&reportViewOnly=true"; let href = `${appEnv.host}/SASReportViewer/?reportUri=${reportUri}${options}`; // save href in appEnv to use for displaying VA report in an iframe appEnv.href = href; |
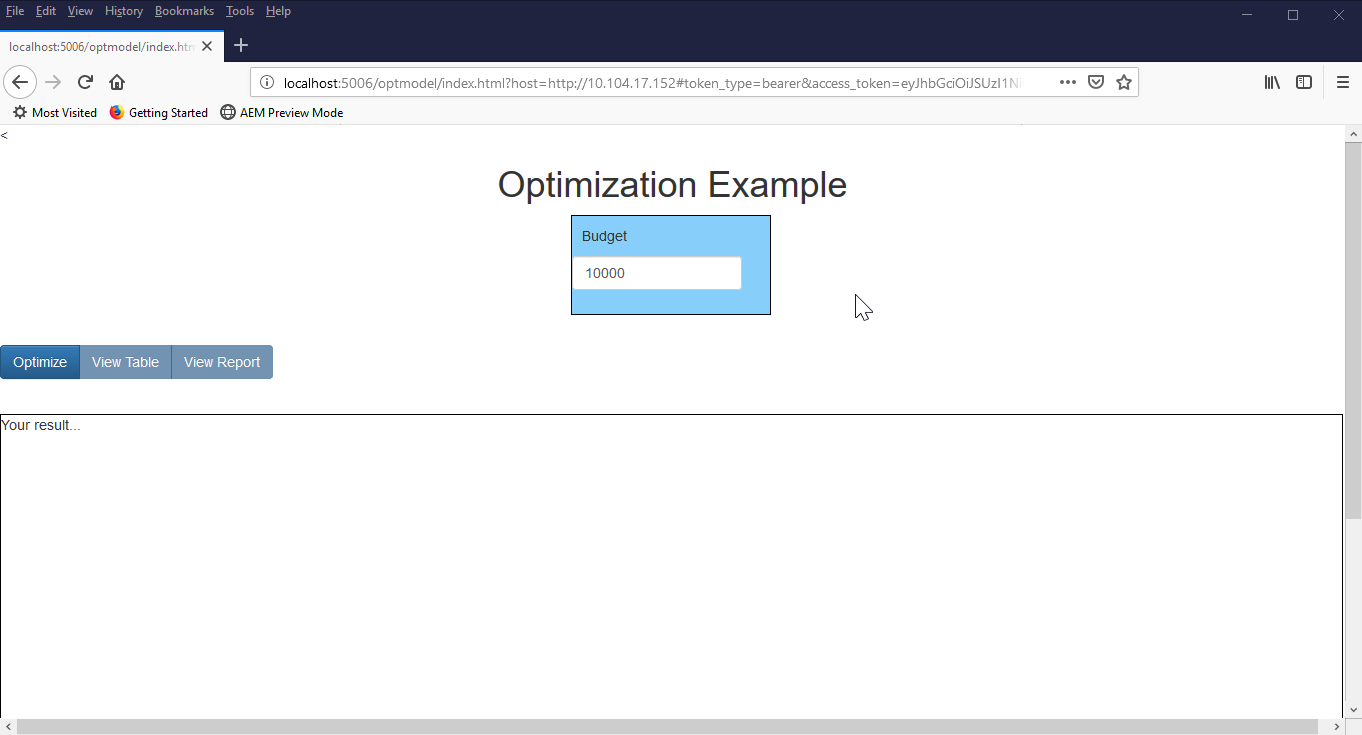
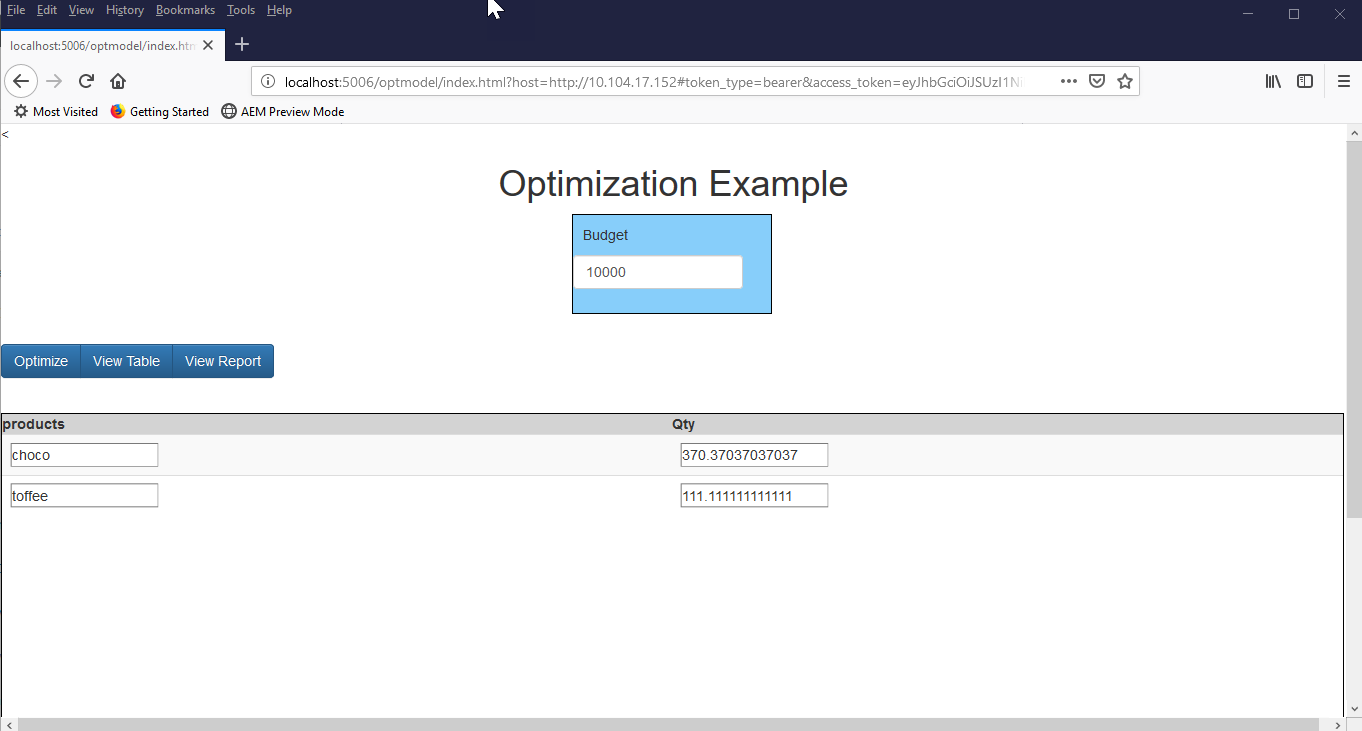
3. Enter budget
Enter budget in the space provided (I use $10,000 in this example) and click the Optimize button. This action instructs the application calculate the amount of chocolate and toffee to purchase based on the model.
4. & 5. Generate and execute CASL code
The code to load the CAS action set, run the CAS action, and store the results in a table, is in the genCode.js file:
/* Assumption: All necessary input tables are in memory */ pgm = "${pgm}"; /*Load action set and run optimization*/ loadactionset 'optimization'; action optimization.runOptmodel / code=pgm printlevel=0; run; /* save result of optimization for VA to use */ action table.save / caslib = '${appEnv.work.caslib}' name = '${appEnv.work.table}' replace = TRUE table= { caslib = '${appEnv.work.caslib}' name = '${appEnv.work.table}' }; /* fetch results to return for the UI to display */ action table.fetch r=result / table= {caslib = '${appEnv.work.caslib}' name = '${appEnv.work.table}'}; run; /* drop the table to force report to reload the new table */ action table.dropTable/ caslib='${appEnv.work.caslib}' name='${appEnv.work.table}' quiet=TRUE; |
Note: The drop table step at the end of the preceding code is important to force VA to reload the data for the report.
6. Get the results - table form
The results return to the application in table form. We now know to buy quantities of 370 chocolate and 111 toffee with our $10,000 budget. Please refer to the casTableViewer for code details of this step.
6. Get the results - report form
Select the View Graph button. This action instructs OptModel1 to display the interactive report with the new data (the report we created in step 2f). Please refer to the onReport function in index.html for code details of this step.
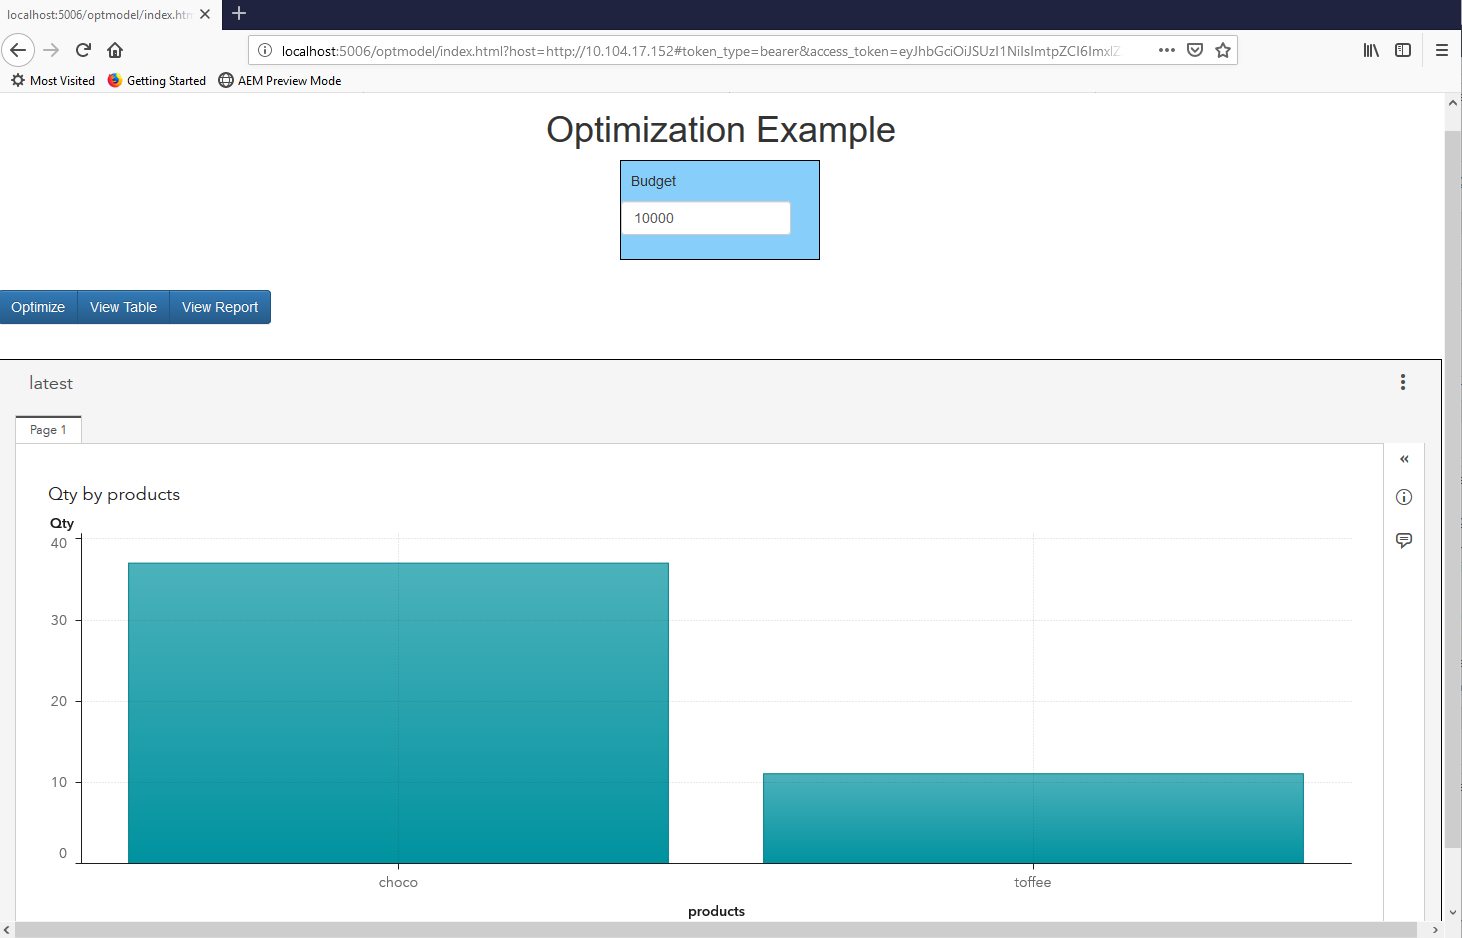
Now that we know how much chocolate and toffee to buy, we can make enough treats for all of the holiday parties just around the corner. More importantly, we see how to integrate SAS REST APIs into our application. This completes the series on using SAS REST APIs. The conversation is not over however. I will continue to search out and report on other topics related to SAS, open source languages, and agile technologies. Happy Holidays!

7 Comments
HI Jose:
restaf is really intended to be used in your html javascript to handle rest calls to Viya - although it can also run on server. restaf understands the design of SAS REST API and thru a few methods users can deal with all the services in a similar manner. Additionally it handles all the data returned from the server for the user. I do not believe SAS has a one-to-one equivalent library in Python.
restaf assumes that you have a app server that serves up the pages- in your case it is a flask-based app server. So even if you use flask as your server you can still use restaf on the client.[Sidebar: If you are interested you can take a look at restaf-server - an opinionated app server designed for use with Viya].
However if your goal is to write the app in a python-only stack then either straightforward python or helper libraries like python-sasctl will be useful. I am not familiar with running python on the browser but I am sure there are ways to do that too.
Cheers...
Deva
PS: and do not forget the authentication flow in your web application - that is always a fun ride 🙂
Hi Joe,
It's me again. All the applications to call SAS Viya REST and SAS CAS REST APIs that I have seen are build using restaf library, from JS. Is there any python library that allows you to do this integration? I want to build a python application through the flask framework and I don't know if the python-sasctl library has the sames functions that restaf library has to JS.
Again, thank you so much for your posts.
Jose
Is there a management level overview of REST API, which doesn't contain a lot of technical details, but shows how you can build a model in SAS Viya and then use an API to actually implement the model in some sort of "production" environment?
Hi Paige,
I'm asking a couple of colleagues about this and will either compile some existing resources or we'll work with you to get some examples created. Stay tuned.
Hi Paige,
Currently, there is no definitive 'one doc' overview of creating and managing models with APIs. We do have a new library on GitHub, python-sasctl. The tool is specifically created for model management using Python. Also, a colleague from SAS Japan has written a blog post on python-sasctl. The post is in Japanese, but can be translated easily in Chrome with the 'Translate' right-click option.
I am working on expanding on the article and general documentation on python-sasclt. If this isn't the path you want to follow, let me know some more details and we'll work on getting more info published.
Joe, I want to use SAS analytics as well as SAS Viya for reporting, but want a tight integration into an already built Helath application (HTM5 (React) application). I read your article on using the REST APIs to call VA reports and get back an SVG. This is what I need but was interested to know whether the whole report would be considered an SVG (with multiple charts, tables key values etc) or are they independed SVG components?
Any help would be appreciated.
Hi Rob,
The article uses the VA report viewer - this is the full application for interactive viewing - so this is the full report with all the graphics - not svg's.
But we can display svg's of all or selected parts of the report as a svg using the reportImages API if you are not interested in interactivity.